A new section:
I’ve already had an interesting response to this post, which at the time of writing has been up for about 24 hours. Comments are still open so do go ahead.
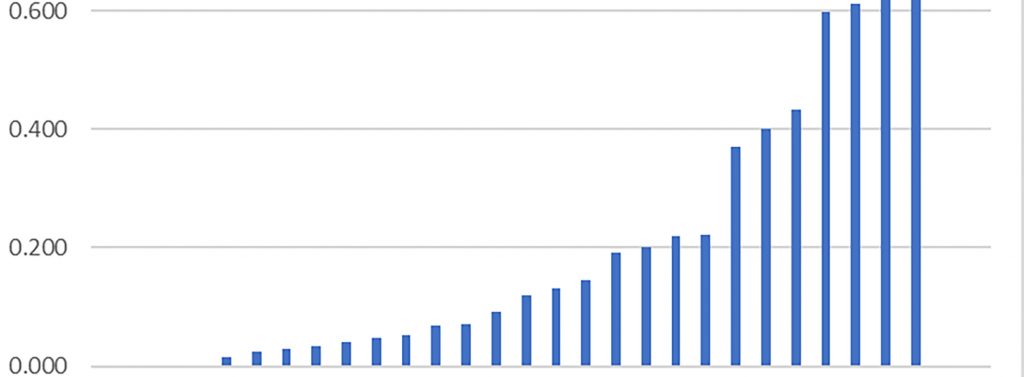
I’m often tempted to do some number crunching, but always a bit worried in case I get something wrong. So this month I decided to put a few pieces of work out there for others to question, trash, check or applaud – whatever they see fit. This isn’t a paper or even a review. It is simply looking at the data I find and seeing where it takes me. This week I’m equating greenhouse gas emissions with protein content. I think we are all familiar with the graphs that show animal products off the scale, but I started wondering what happens if you equate emissions to protein content, rather than weight of product. For example we all know that legumes, such as lentils are a great source of protein, but we have to eat about three times the weight to get a similar protein hit comparable to chicken, eggs or milk, for example. The results are illuminating. Legumes, because of their lower protein content, compared to their bulk, come in as much higher greenhouse gas emitters than animal products such as yoghurt and wild fish and higher than milk.
Please do comment and together we can make the figures even more robust.
Draft results:
Notes
Protein: For simplicity I have used a list of protein content of common foods from The British Nutrition Foundation. While they don’t divulge their source (not a good policy) my guess is that they would have got the information from here: https://www.gov.uk/government/publications/composition-of-foods-integrated-dataset-cofid
This is a publicly available set of data covering many different food types and all the nutrients you could hope to investigate. Drawbacks for such data sets is that foods are very varied and protein content for items such as brown bread should be taken with a pinch of salt. Our UK definition of brown bread, and doubtless the bread used in this sort of study would have been 50% brown and 50% white flour – so lower in protein than a true 100% wholemeal loaf. Plant-based products such as lentils and peas will have varying levels of protein content depending on the source of the product, how it is grown and how much rain fell that year. So small differentiations between different foods should be discounted.
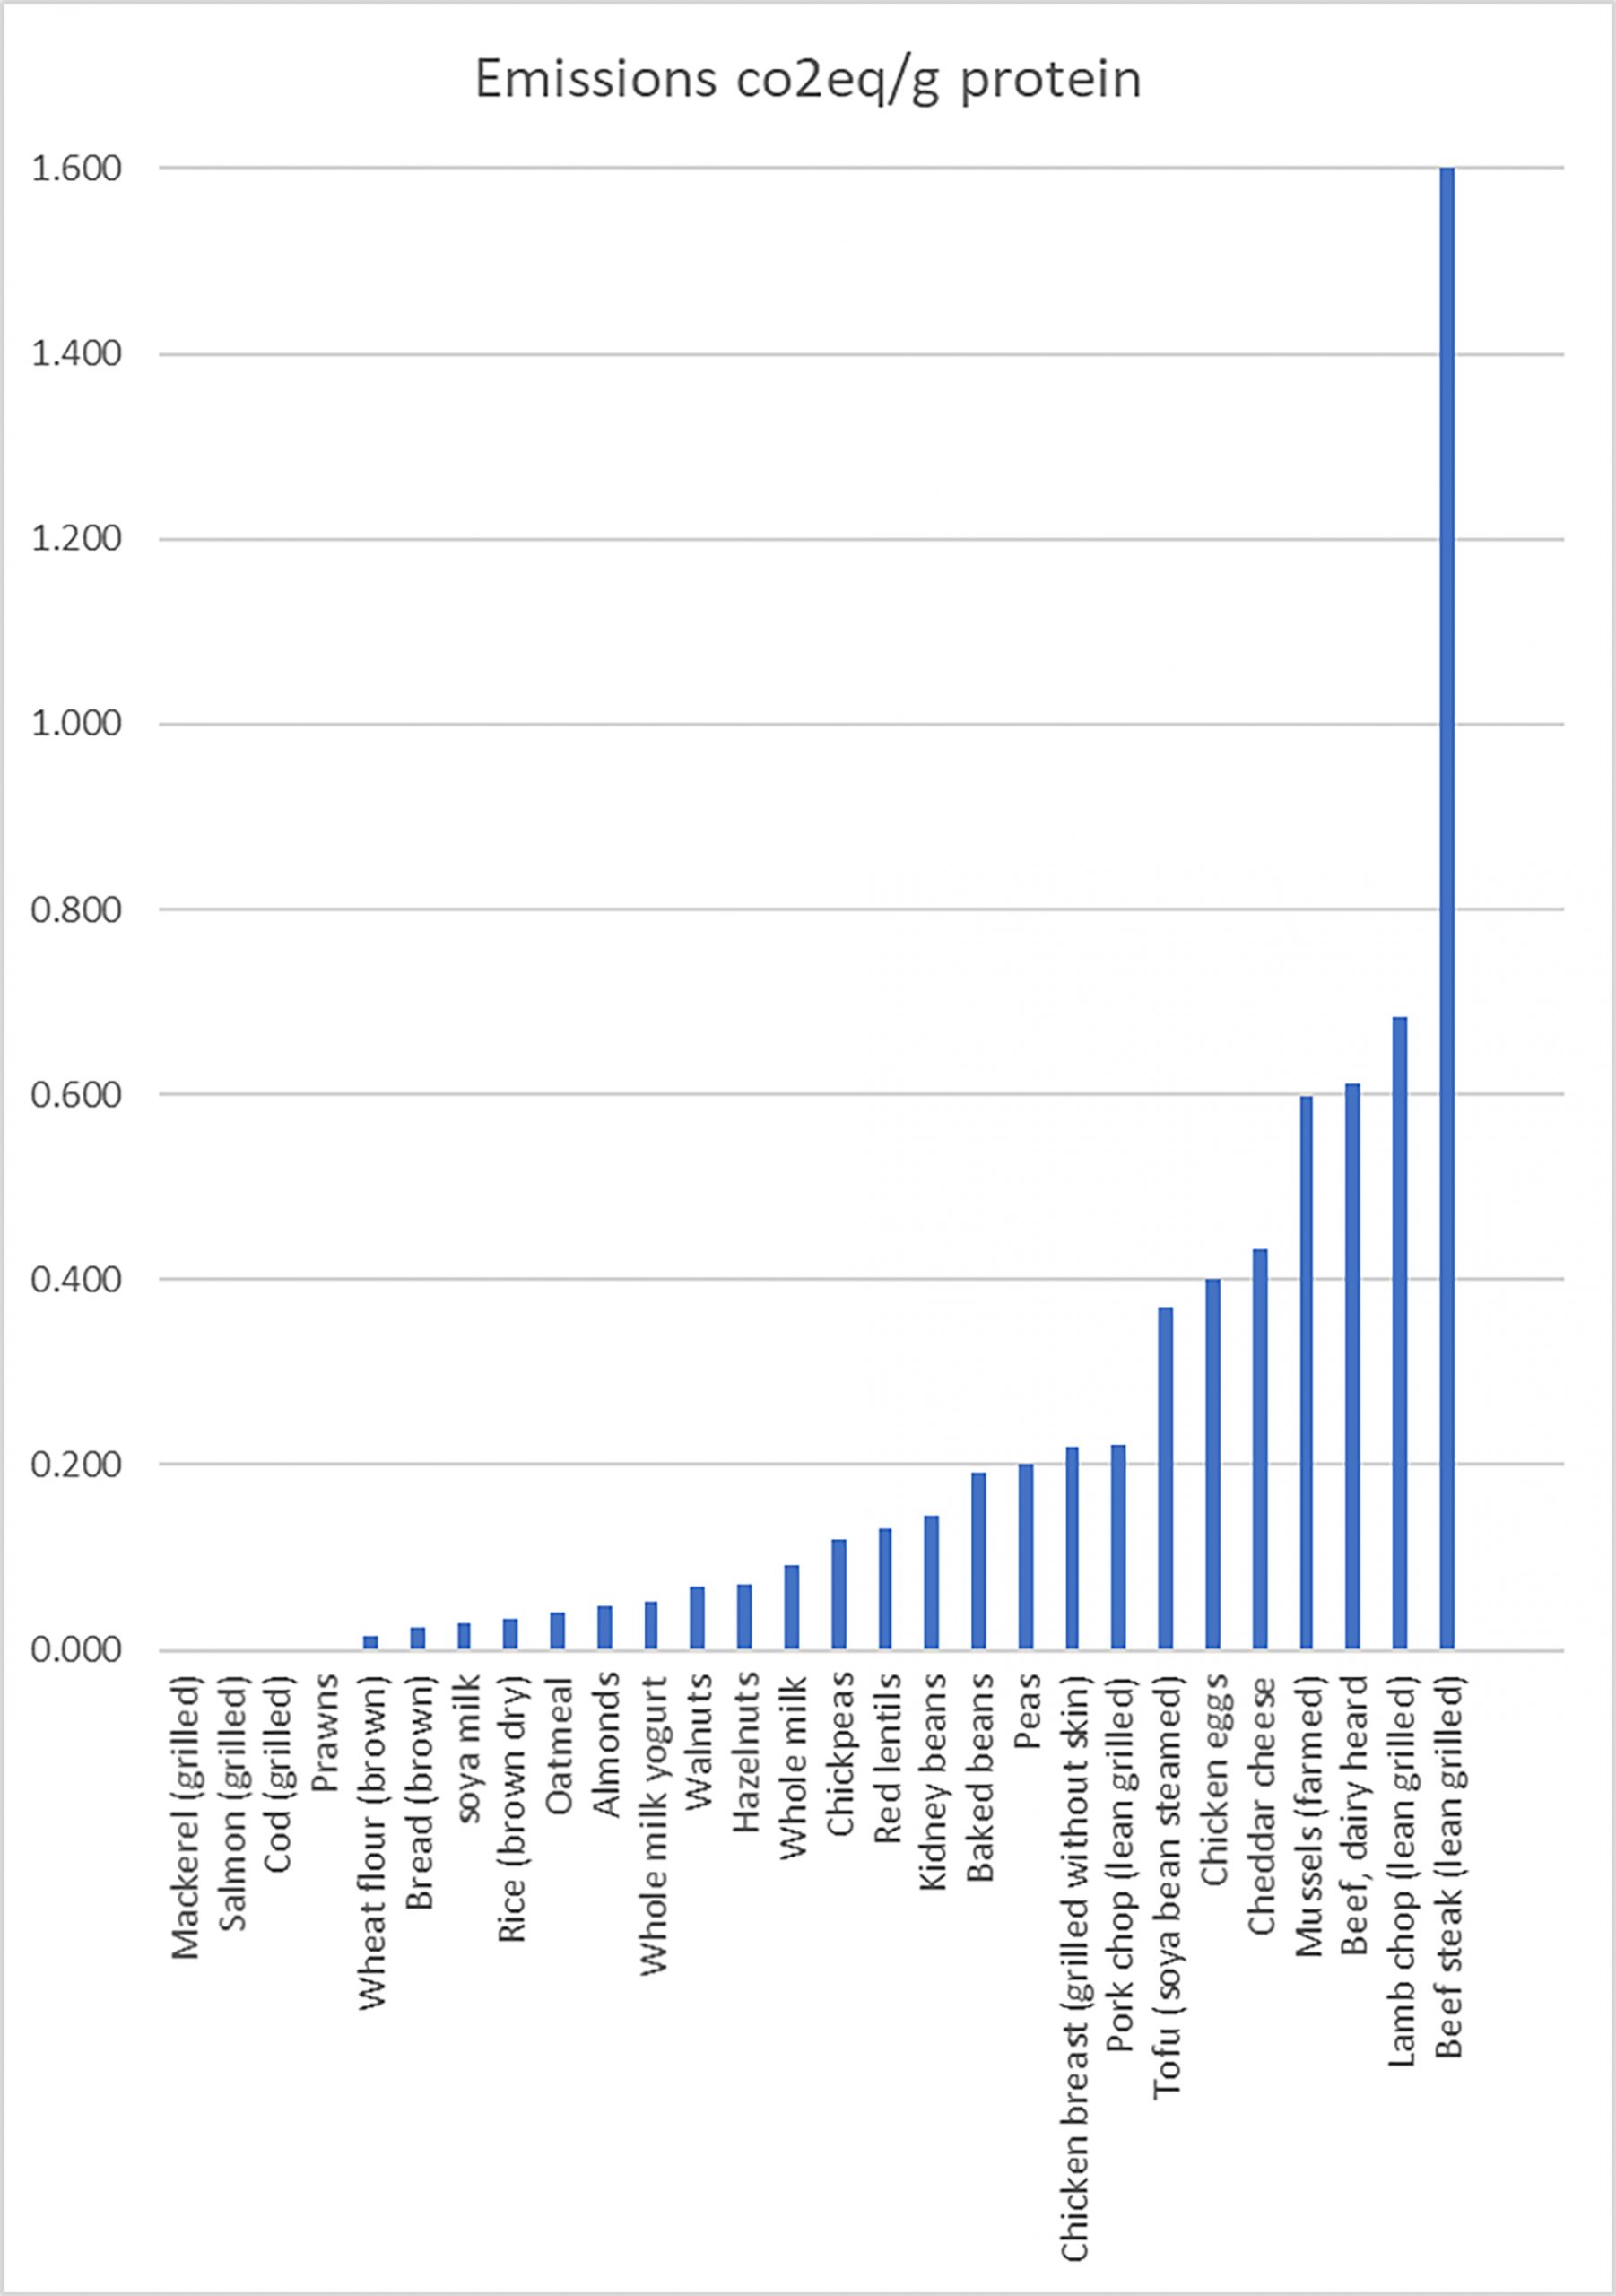
Here are the figures I used:
And the sources:
Line 1: Protein content of some common foods found in the diet. British Nutrition Foundation:
(g pure protein per 100g food weight)
Line 2: Mean Greenhouse Gas Emissions CO2 equivalents/100g food weight from:
Poore, J. & Nemecek, T. Reducing food’s environmental impacts through producers and consumers.
Line 3: Mean Greenhouse Gas Emissions CO2 equivalents/g pure protein – calculated 2/1
COMMENTS
My friend Linus Rees (@LinusRees) has kindly spent quite a lot of time scrutinising the figures. I’ll paraphrase some of his comments:
Green House Gas Emissions:
‘You are looking at CO2, not all greenhouse gas emissions and cows emit mainly methane (CH4)’.
However, after some discussion it looks like the figures I am using are for CO2 equivalents and should include methane and other greenhouse gasses. Here’s what the paper says,
For greenhouse gas emissions, we further disaggregated the farm stage into 20 emission sources. We then used the inventory to recalculate all missing emissions. For nitrate leaching and aquaculture, we developed new models for this study.
Later on, the study specifically mentions methane, so I think we can be assured that methane is included in the figures.
The figures don’t include transport and post farm emissions. The study says,
‘The farm stage dominates, representing 61% of food’s GHG emissions (81% including deforestation)…
Linus gave two interesting links which I copy here:
Reducing Bovine Methane
The first article is about scientists who are inventing a vaccine to reduce bovine emissions of methane.
https://www.bbc.com/future/article/20190806-how-vaccines-could-fix-our-problem-with-cow-emissions
I’d be interested to hear what people think of this. I would be cautious about any intervention that might interfere with a cow’s natural processes and potentially change the delicate and complex nature of the milk.
Shifting Habits
https://www.wri.org/publication/shifting-diets
The World Resources Institute (WRI) is not an organisation I had come across before, but it seems to have a good reputation as a liberal organisation. It is mainly based in the US, so much of their work refers to US agricultural processes which are very different to those of Europe. This report is again interesting and recommends shifting away from animal-based eating.
How much protein do we need?
Bear in mind that this report states that the average consumption of protein per day in the USA is 90g and that the average daily protein requirement is 50g, working on a daily intake of protein intake of 0.8 g protein/kg body weight/day.
The average weight of adults in the UK is 77kg (the US the figures are higher). I’mnot sure how 50g at 0.8g protein/kg/day could possibly feed the average American. It is about right for someone of middle-age weighing 62.5kg, i.e. considerably lighter than the average UK woman (11 stone or 70.2kg according to ONS 2010 figures).
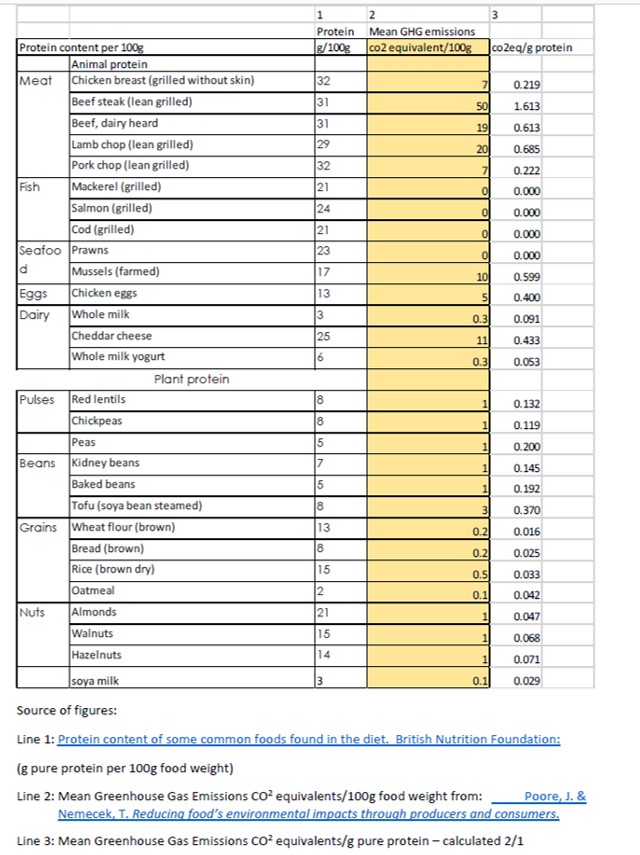
I would advise that women over 50 start to eat more protein and slightly less carbohydrate and fats. If a woman of average height and built were to eat 1g protein per kg weight/day they should be eating about 70g pure protein. So, for many of us it may not be about reducing protein consumption as much as making relatively minor changes to the type of protein we eat. From the graph below you can see a fairly conventional representation of the impact of various types of protein from the WRI report. This one is interesting because everything is related to protein consumption – so you can compare directly with my graph. What is blindingly obvious is that it is not the greenhouse gas emissions from cows that causes such high levels of ‘unsustainability’. It is the extent of the land used and the amount of water that is needed to produce the milk or meat. You will also notice that fish is always included as farmed fish. As far as I can work out wild fish produces no greenhouse gas emissions during production, uses zero land and zero water – so it is technically and uniquely capable of being infinitely sustainable. The catch (no pun intended) is the cost of fishing, transportation and the dangers of over-fishing.
NB:
This report is not entirely transparent about where the figures above come from. They refer liberally to a GlobiAgri model which is their own model, as far as I can tell. (Further information here would be really welcomed)
Sustainability
Miriam Heppel (@miriamheppell) puts her finger right on the point when she comments (again over twitter)
‘There is more to sustainability than CO2 emissions.’
I totally agree. I’m interested to see the real big figures are not emissions (though they may directly impact on climate change in a way that other sustainability issues do not.) The major impact of meat and dairy is on land-use and water use. I suppose that brings us back full circle to the debate about whether all land is created equal. Obviously, we can’t grow lentils in Cumbria or North Yorkshire (where the sheep graze), neither can we grow soya beans on dairy pastures further south. I for one have no time for grain fed animals, which seems cruel to the animal. It is neither nutritionally suitable for the animal, missing some really important nutrients such as zinc, and that nutritional imbalance is thus passed onto humans in poor quality milk and meat. To paraphrase The Bible, neither man nor beast can live by cereal alone.
Buy grass fed, buy British?
Louise Gray (@loubgray) has written an excellent article in the Guardian which gives a bit more background to these issues. She suggests sourcing from grass fed and British producers, where you know the quality will be good and the husbandry and sustainability second to none. https://www.theguardian.com/food/2020/feb/04/life-after-veganuary-the-ethical-guide-to-eating-meat-eggs-and-dairy
But its isn’t just in the UK that things are changing. I noticed in Southern Spain that you can now get grass fed milk and yoghurt in all the supermarkets. It is even sold on the fast train I take to get down there, doubly reducing my carbon footprint.
And Joanna Blythman (@JoannaBlythman) regularly tweets and writes about the differences between sustainable animal farming and unsustainable. Her twitter feed is a mine of useful information.
For today I leave the last word to CashAndCarrots a great GYO advocate with whome I enjoy regular twitter conversations. @cashandcarrots
‘Hi Wendy, are the emissions figures a global average or particular to UK? Given the amount of grassland here in UK used for raising livestock (as compared to feedlot based systems) our emissions from livestock are, because of the sequestration, a lot lower than average.’
Please comment below or via my twitter handle. Rooftopvegplot @rooftopvegplot