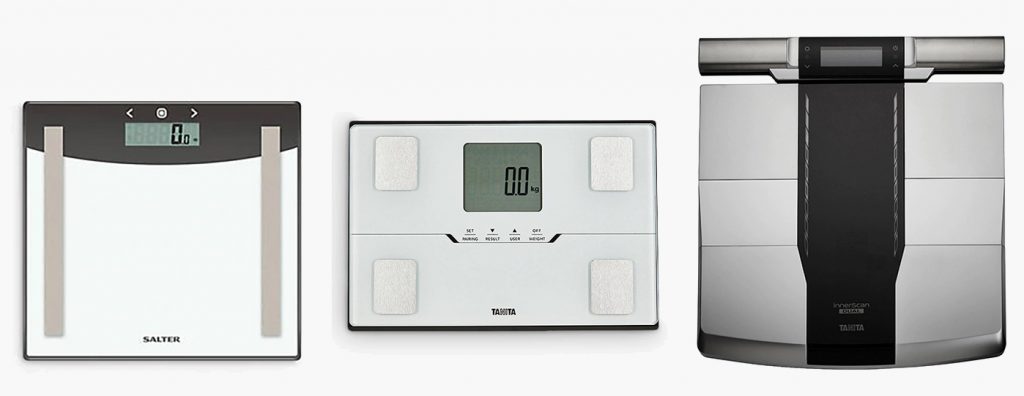
Salter Glass Analyser,
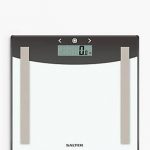
Tanita BC-401,
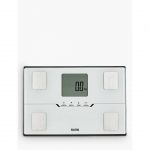
Tanita RD-545
Since body composition analysers hit the domestic market about ten years ago their accuracy and sophistication has improved and the prices have plummeted. But are all those extra features necessary and more importantly are they accurate?
At a glance: The pros and cons of different machines
CHEAPEST
Salter Analyser. About £20.00. Simple, portable*: Single frequency foot to foot scale. Susceptible to being moved about. Fiddly to record more than weight. Requires careful, consistent and regular use in the same location to build up a useful picture. No smartphone connection. 8 user memory. (<180kg) (Many slightly different models but all identical under the hood.) It uses a single current of <1mA.
GOOD VALUE
Dual frequency foot to foot analyser Tanita BC401 – medium priced – about £80. Small and easily portable*. In the test returned very similar results to the much more expensive RD545, (<150kg). Does not provide muscle strength. Small footpads, may be difficult to balance for larger shoes sizes. Small number of users – 4. Linked by Bluetooth to a smartphone. The dual current is 100μA, delivered at 50KHz and 6.25kHz
THE WORKHORSE
Dual frequency foot to hand (four pole) analyser Tanita RD 545. Expensive, about £400.00, but able to provide a more detailed picture of different body compartments and differences between limbs. The only one to offer muscle strength calculation. Advertised as containing the same technology as the medical grade (which are considerably more expensive). Slightly higher dual current is 120μA, delivered at 50KHz and 6.25kHz and will weigh someone up to 200kg. Large and comfortable footpad. Robust and easy to use, but heavier, so not really portable. Can only remember a small number of subjects – 4. Linked by Bluetooth to a smartphone.
*Remember to remove batteries if you travel with these machines, movement may accidentally switch them on and drain the batteries or alter the settings.
How modern digital analysers work
The weight of the body is made up of many things, bones, muscles, organs, soft tissue, skin and fluids. However, because of the way we investigate body composition muscle, organs and soft tissue is rather lumped together. Most sophisticated machines such as MRIs or DXA scans[i] measure either water content or density of tissue and relate it to a visual image, a bit like a three D x-ray. From the measurements a picture of the body can be seen, which is very useful for diagnostic purposes. However, all of these systems require computer calibration and each one will not distinguish tissue in the same way as another system. So, the results are different depending on the machine you use.
Body composition weighing scales all work slightly differently too. Unlike DXA and MRI they don’t produce a picture of the body. Instead the machines simply take a couple of measurements and use those data to predict what might be going on inside. Thus, they will always be less accurate that the larger hospital-based machines. Neither do they measure body fat or bone mass directly. Instead they use electrical resistance and flow rate to establish a proxy for body composition. This is quite different to direct measurements taken by old fashioned balance scales and tape measures, where direct measurements are taken. Even the most sophisticated body composition analysers still requires approximations to be taken and calculations to be made.
Weight
All digital scales measure a change in electrical resistance inside a miniature circuit that responds to pressure as you step onto the scales, exerting weight. This is a tried and tested mechanism, found in all sorts of scales from your kitchen scales to industrial models. So, it was quite disappointing to discover that all three machines often returned different weights.
Body Composition
Single frequency body composition analysers – how they work
A tiny current is run from one foot to the other. The resistance of your body to the current provides an indication of body composition. High water content produces a lower resistance, consistent with lower fat mass. There is no water in your fat cells. It is however present in different concentrations in blood, muscle or bone, so a higher resistance implies higher fat mass. With foot to foot single frequency only the composition of the lower body can influence the results. The tiny current takes the shortest route that it can, going up one leg and down the other.
Dual frequency body composition analysers – how they work
With dual frequency more sophisticated calculations can be made, by measuring the split-second time differences it takes for different frequencies to pass through different types of body tissue. Bone and muscle will produce different results or fatty tissue, where the signal cannot pass as quickly.
Four ‘pole’ body composition analysers – how they work
These are more sophisticated, being similar to medical grade body analysers. With these you have to hold a handle, as well as step onto metal sensors. They can analyse the differences in composition of each arm, each leg and the trunk, by passing the two tiny currents from foot to foot, arm to arm, down the right side and then the left side. This requires the subject to remain standing relatively still for a minute or two. The theory is that by returning more data, better comparisons can be made with reference populations and more accurate estimates can be made.
However, it is important to stress that in each case body composition results require calibration. This is achieved by measuring hundreds of different people in a reference population, using bio-impedance and comparing with more direct assessments such as DXA scans.
Researchers use equations to compare the bio-impedance result to various other measures – some of which you have to enter before you stand on the analyser, these are: height, age, gender and sometimes latitude. The more your shape differs from an ‘average’ the less likely the analysis will be valid. Though all the calibration these days includes older people, and those whose weight falls outside the healthy norms. Most machines advertise their accuracy up to the age of 99, but it is inevitable that at the far ends of the age scale fewer subjects have been used in the calibration studies.
Height, age and gender are key. Latitude effects weight, but very slightly, and if my results are anything to go by, the differences are not significant. Some machines have an athlete’s setting which allows people who are fit and possess high muscle mass to use a different equation.
If you are of medium height and build, Caucasian and typical for your gender and age group, the reading is likely to be quite accurate. If you are perhaps from a different ethnic group, very overweight, or very thin, or your muscles or fat are unevenly distributed, then the results will be less accurate. Similarly, if you have been lying down recently your body water may not represent the norm for a standing person. If you’ve just drunk a glass of water, or opened the bowels or bladder the estimation of body water will be different.
In addition, the reading of foot to foot can be affected by the distribution of water within the body and produces different readings immediately after rising. For all the machines I recommend that you stand upright for about ten minutes before being measured. The analysers cannot distinguish between the contents of the stomach or intestines. That is why a better reading is achieved by weighing yourself first thing in the morning, when you have fasted all night and after passing water and emptying the bowels. Coming direct from the shower will not affect the readings. Slightly damp – but not wet – feet can help to achieve a good electrical current.
Why should women of our age use a body composition analyser?
For women, the age of about fifty years brings many changes to the body, including the menopause. These hormonal changes can trigger compositional changes in the body, including reduced bone mass, reduced muscle mass and increased fat mass, any of which can have bad consequences. So, for women like us, simply weighing ourselves regularly is not enough. While these body composition changes are happening, our weight may seem stable or even reduce a bit. Without any form of analysis, we can mistake this change for a beneficial lowering in weight, yet it might instead herald a dangerous loss of bone or muscle. Once you hit 50, it is far more difficult to re-build bone and muscle mass, so any attempt to lose or gain weight, in order to reach a healthy weight should not be attempted without some analysis of body composition as well. Many studies have shown that simply losing weight is not a passport to longevity, in fact it can be an indication of ill health – so body composition is, in my view, absolutely vital. Sadly, none of these machines can be used with a pacemaker or other electrical implants.
Accuracy of body composition analysers
None of these machines claim to be 100% accurate, though many suggest that they can achieve something like 95% accuracy if measured against the gold standard for body composition which is a DXA scan. But there are some caveats to all these measurements. Muscle ebbs and flows all day and night, building in response to nutrients and then breaking down again after exercise. Both the breakdown and the re-building have to happen in order to maintain healthy muscles. Thus muscle tone also changes like the wind, you are likely to find these figures fluctuating. In addition, weight changes every day. It is only by recording the trends over the weeks and months that you can find anything useful. I’ve added the trend lines into some of the results graphs below to indicate how important it is not to get hung up on small, day to day changes. In the study some of the machines showed small downward trends over the week-long trial, while others indicated small upward trends.
I weigh myself every day, but only do a body analysis once a week. I also take periodical waist measurements, which are a good simple proxy for visceral fat.
The study
Method:
I decided to use the three domestic body composition scales I had already purchased for other reasons, having purchasing them all full-price from John Lewis over the past two years. I received no inducements or discounts for their purchase.
I selected a week in which there would be no days of over or under eating. These were post-Christmas days, where I generally ate at home and was in control of my normal healthy diet (ie I’m not on any form of reducing diet at the moment.)
Day 1 was a pilot set-up day. Weights were not recorded first thing in the morning and post-fast – so have been excluded from the data.
Day 2-9, I weighed myself on all three machines and recorded the differing results. I treated this as normal domestic use, weighing myself in the morning after rising and washing, before eating or drinking anything and after emptying bladder and bowels.
Both Tanita machines were stored close to the wall and pulled out every day for weighing. I was already aware that the Salter machine does not take kindly to being moved, and so efforts were made to keep that machine in exactly the same spot throughout the week.
Results for the Salter Analyser were recorded in pencil on a wall chart, the Tanita machines sent data direct to a programme on my smart phone.
Results
It proved difficult to achieve consistent readings from the salter machine, not only did the figures differ each time I stepped on the machine, but it was difficult to write down the results as they cycled on the scales. I carried a light pencil in order to capture the results. Where it was necessary to take more than one measurement to record a full set of results, the overlapping data were averaged.
Weight
The Salter machine returned less consistent weights compared to either Tanita machine. This was in spite of greater care being taken to keep the Salter machine in a stable position. With Salter a much higher fluctuation was recorded.
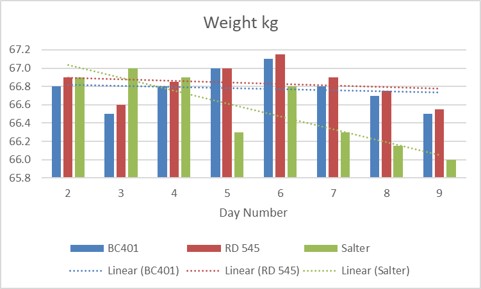
Result 1. Weights recorded with three different machines, Tanita BC401, RD 545 and Salter Analyser. Dotted lines represent mathematically derived trendlines.
Body water
Notable differences can be observed between the Salter and Tanita machines. On some days body water percentage returned large differences between the manufacturers. For example, on day 2 Salter recorded 40.3%, while RD 545 recorded 47.6%, a difference of more than 15%. All three machines derive their body composition data from measuring the amount of body water in the body, so by comparing the differences between these figures we can gain some insight into why the machines will return different results for fat, muscle and bone mass.
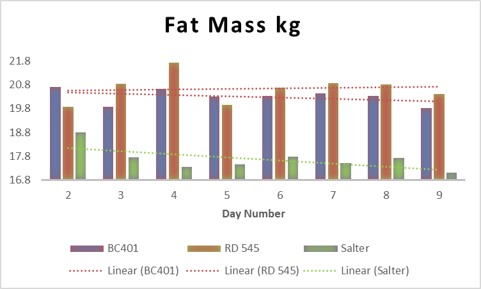
Fat mass
For each machine I converted fat percentage to fat mass, by simple multiplication (fat mass=weight x body fat %). As both weight and water content was inconsistent between the machines, then the fat masses they returned were also different. This also compounded differences in results for bone and muscle mass, where available.
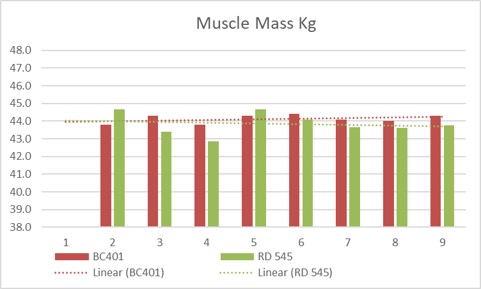
Muscle Mass
Both Tanita machines recorded roughly similar muscle mass. The salter machine does not record muscle mass.
Other measurements
The top of the range machines also return results for muscle quality, bone mass, body mass index, visceral fat, metabolic rate, metabolic age and physique rating. These are all useful to the clinician, but might be a step too far for the novice. A simple useful cross check for bio-impedance include taking measures with a tape measure. Waist circumference can gauge visceral fat and mid upper arm and calf circumference gives an indication of muscle mass. Muscle strength can be measured using special grip and weighted machines, though for older people there are some quite interesting proxies, such as how fast you walk and how quickly you can get up from a chair, or sit up from a lying down position on the floor.
There is very little published data to indicate how the bio-impedance results actually correlate to such measures as metabolic age. While body composition does represent part of the ageing process it is by no means all. Further results might look at blood pressure, blood chemistry and lung capacity. I do this with my clients, to gauge a much clearer picture of their general health. Ageing is a reality, but age is purely a number.
Discussion
Over such a short period of time and recording only one person, it would be impossible to derive any scientifically significant data. In many ways it doesn’t matter whether any of these machines record a few percentage points of higher weight or fat mass. When body composition is changing it is the trends that are interesting. Such trends will become apparent over months and even years, and any of these machines would provide adequate information to track simple weight. However, only the Tanita machines seem reliable and consistent enough to be used for body composition.
Of the two Tanita analysers, the considerably cheaper Tanita BC 401 seems to give pretty good results and is delightfully portable. However, I am of average height, with a healthy BMI and a relatively evenly distributed muscles and fat. Someone of a different shape may not find that foot-to-foot readings tell the whole story1.
What is happening when we lose weight?
When we diet, we rely on the body’s natural way of dealing with too little food. Very quickly the body uses up glycogen stores in the liver, that represents quickly accessible fuel. Then, it will start to use up fat stored in our adipose tissue, which is located all around the body. Finally, the body will start to use protein as fuel. It retrieves the protein principally from our arm and leg muscles, that are called appendicular muscles. Eventually if you really eat too little, or the wrong balance of foods, the body will start to use up muscle and fat from elsewhere. The loss of connective tissue and things like heart muscle would be a very serious cause for concern. But appendicular muscles are pretty important too.
This is why we measure weight, fat and muscle mass during a controlled diet. When women get to the age of menopause, the loss of muscle mass becomes even more important because it becomes progressively more difficult to regain muscle mass as our hormone pool dwindles. Muscles require growth hormone every single day to repair and re-grow.
Unfortunately, it is impossible to dictate to the body which fuel to use and where to get it from. While the glycogen, fat, muscle progression is generalised, in fact our metabolism cycles between these throughout the day, balancing and re-balancing depending on our needs and our diet.
You can think of this as if the body were a pin-ball machine. You tweak the lever of the machine (our body) by eating less. Then, by virtue of a series of metabolic gradients and chemical triggers, the deficit of fuel is gleaned from any of these locations; liver, fat, muscle or organs. These gradients and triggers are just like the springs and buffers in a pin-ball machine. You might pull the trigger ten time and each time the ball ends up somewhere different.
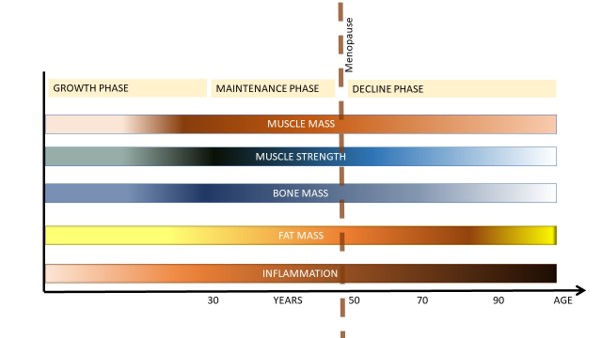
How does body composition change for women?
From 2
In the UK adulthood is celebrated at the age of eighteen. However, physically the body does not attain peak strength until much later into our twenties. Throughout childhood and adolescence bones, muscles and organs continue to grow. While height tends to settle down in the late teens, the body continues to mature and strengthen well beyond that point. As many athletes know, as soon as peak strength is reached, the body tends to slow down, and throughout our thirties and forties we start to lose some bone mass and muscle strength. This gradual decline continues unabated in men, but in women the decline is linked to menopause and can be more dramatic.
Women are increasingly more at risk of losing bone and muscle mass as soon as they reach menopause. It becomes increasingly more difficult to re-grow muscle and bone after an injury or after dieting. However fat mass does not decline. Unfortunately for our figures, fat mass tends to increase, not just replacing lean muscle mass, but also increasing subcutaneous (fat under the skin) and visceral fat, the fat that exists inside the body cavities. Fat that grows inside the body cavity can interfere with the function of organs, in particular the pancreas and the heart. Two of the machines I tested (Tanita RD-545 and Tanita BC-401) make an estimation of visceral fat, as well as returning percentage fat mass overall.
As we age, accumulated fat becomes more and more active. Within and between fat cells a myriad of different cells congregate that are principally involved in creating or attacking disease. These inflammatory cells tend to increase with age. We become more susceptible to infections of different kinds and the inflammatory macrophages increase as we need them more and more to act as cellular vacuum cleaners, clearing away damaged and diseased tissue. Macrophages do their work by overrunning alien cells, engulfing them and then breaking them down into their benign constituents, that are then flushed away. However, in doing this really important job, the cells expand, and it is that inflammation that can cause a number of diseases in old age, such as arthritis.
When we get really old and frail, body fat tends to atrophy along with bone and muscle. This dynamic, the ebb and flow between muscle and fat, can be hidden from view if you measure simple weight. It is not uncommon for older people to have lost muscle and bone mass, but gained fat mass. If they have simply been weighing themselves, they may be blissfully unaware until other serious symptoms develop.
- Jebb, S. A., Cole, T. J., Doman, D., Murgatroyd, P. R. & Prentice, A. M. Evaluation of the novel Tanita body-fat analyser to measure body composition by comparison with a four-compartment model. Br. J. Nutr. 83, 115–122 (2000).
- JafariNasabian, P., Inglis, J. E., Reilly, W., Kelly, O. J. & Ilich, J. Z. Aging human body: Changes in bone, muscle and body fat with consequent changes in nutrient intake. J. Endocrinol. 234, R37–R51 (2017).
[i] MRI stands for Magnetic Resonance Imaging. The machines use magnetic fields and radio waves to count the way hydrogen atoms are aligned in the body. Thus, it relies on computer technology and the differences between the water (H2O) content of different types of tissue. X-rays are not involved.
DXA stands for Dual energy X-ray Absorptiometry. The machine sends low-dose x-rays through the body, using two different energy levels. Tissue of different density will show up differently. Thus, it is useful for measuring the density of bones damaged by osteoporosis.
Thank you very much for your study! This is the first study I come across from Google about comparing the reading of different scales for some days.
It does not confirm my experience that the four-pole scale gives more fluctuating results than feet-only scales, maybe because the upper-body route involves more uncertainty than the lower-body route?
For me, my feet-only scale (a middle-priced Tanita) gives a 5% lower body fat percentage than my 4-pole scale (Bodypedia). I am a mid-40 male. I am just wondering if my Bodypedia is giving right numbers.
Hats off to you for going to the great effort to write this and in the format of a scientific report. Excellent stuff.
Thanks Leon,
There are very few scientific analyses of these machines. I thought it was time to spread a little information.
Wendy